FIGUR8

OVERVIEW

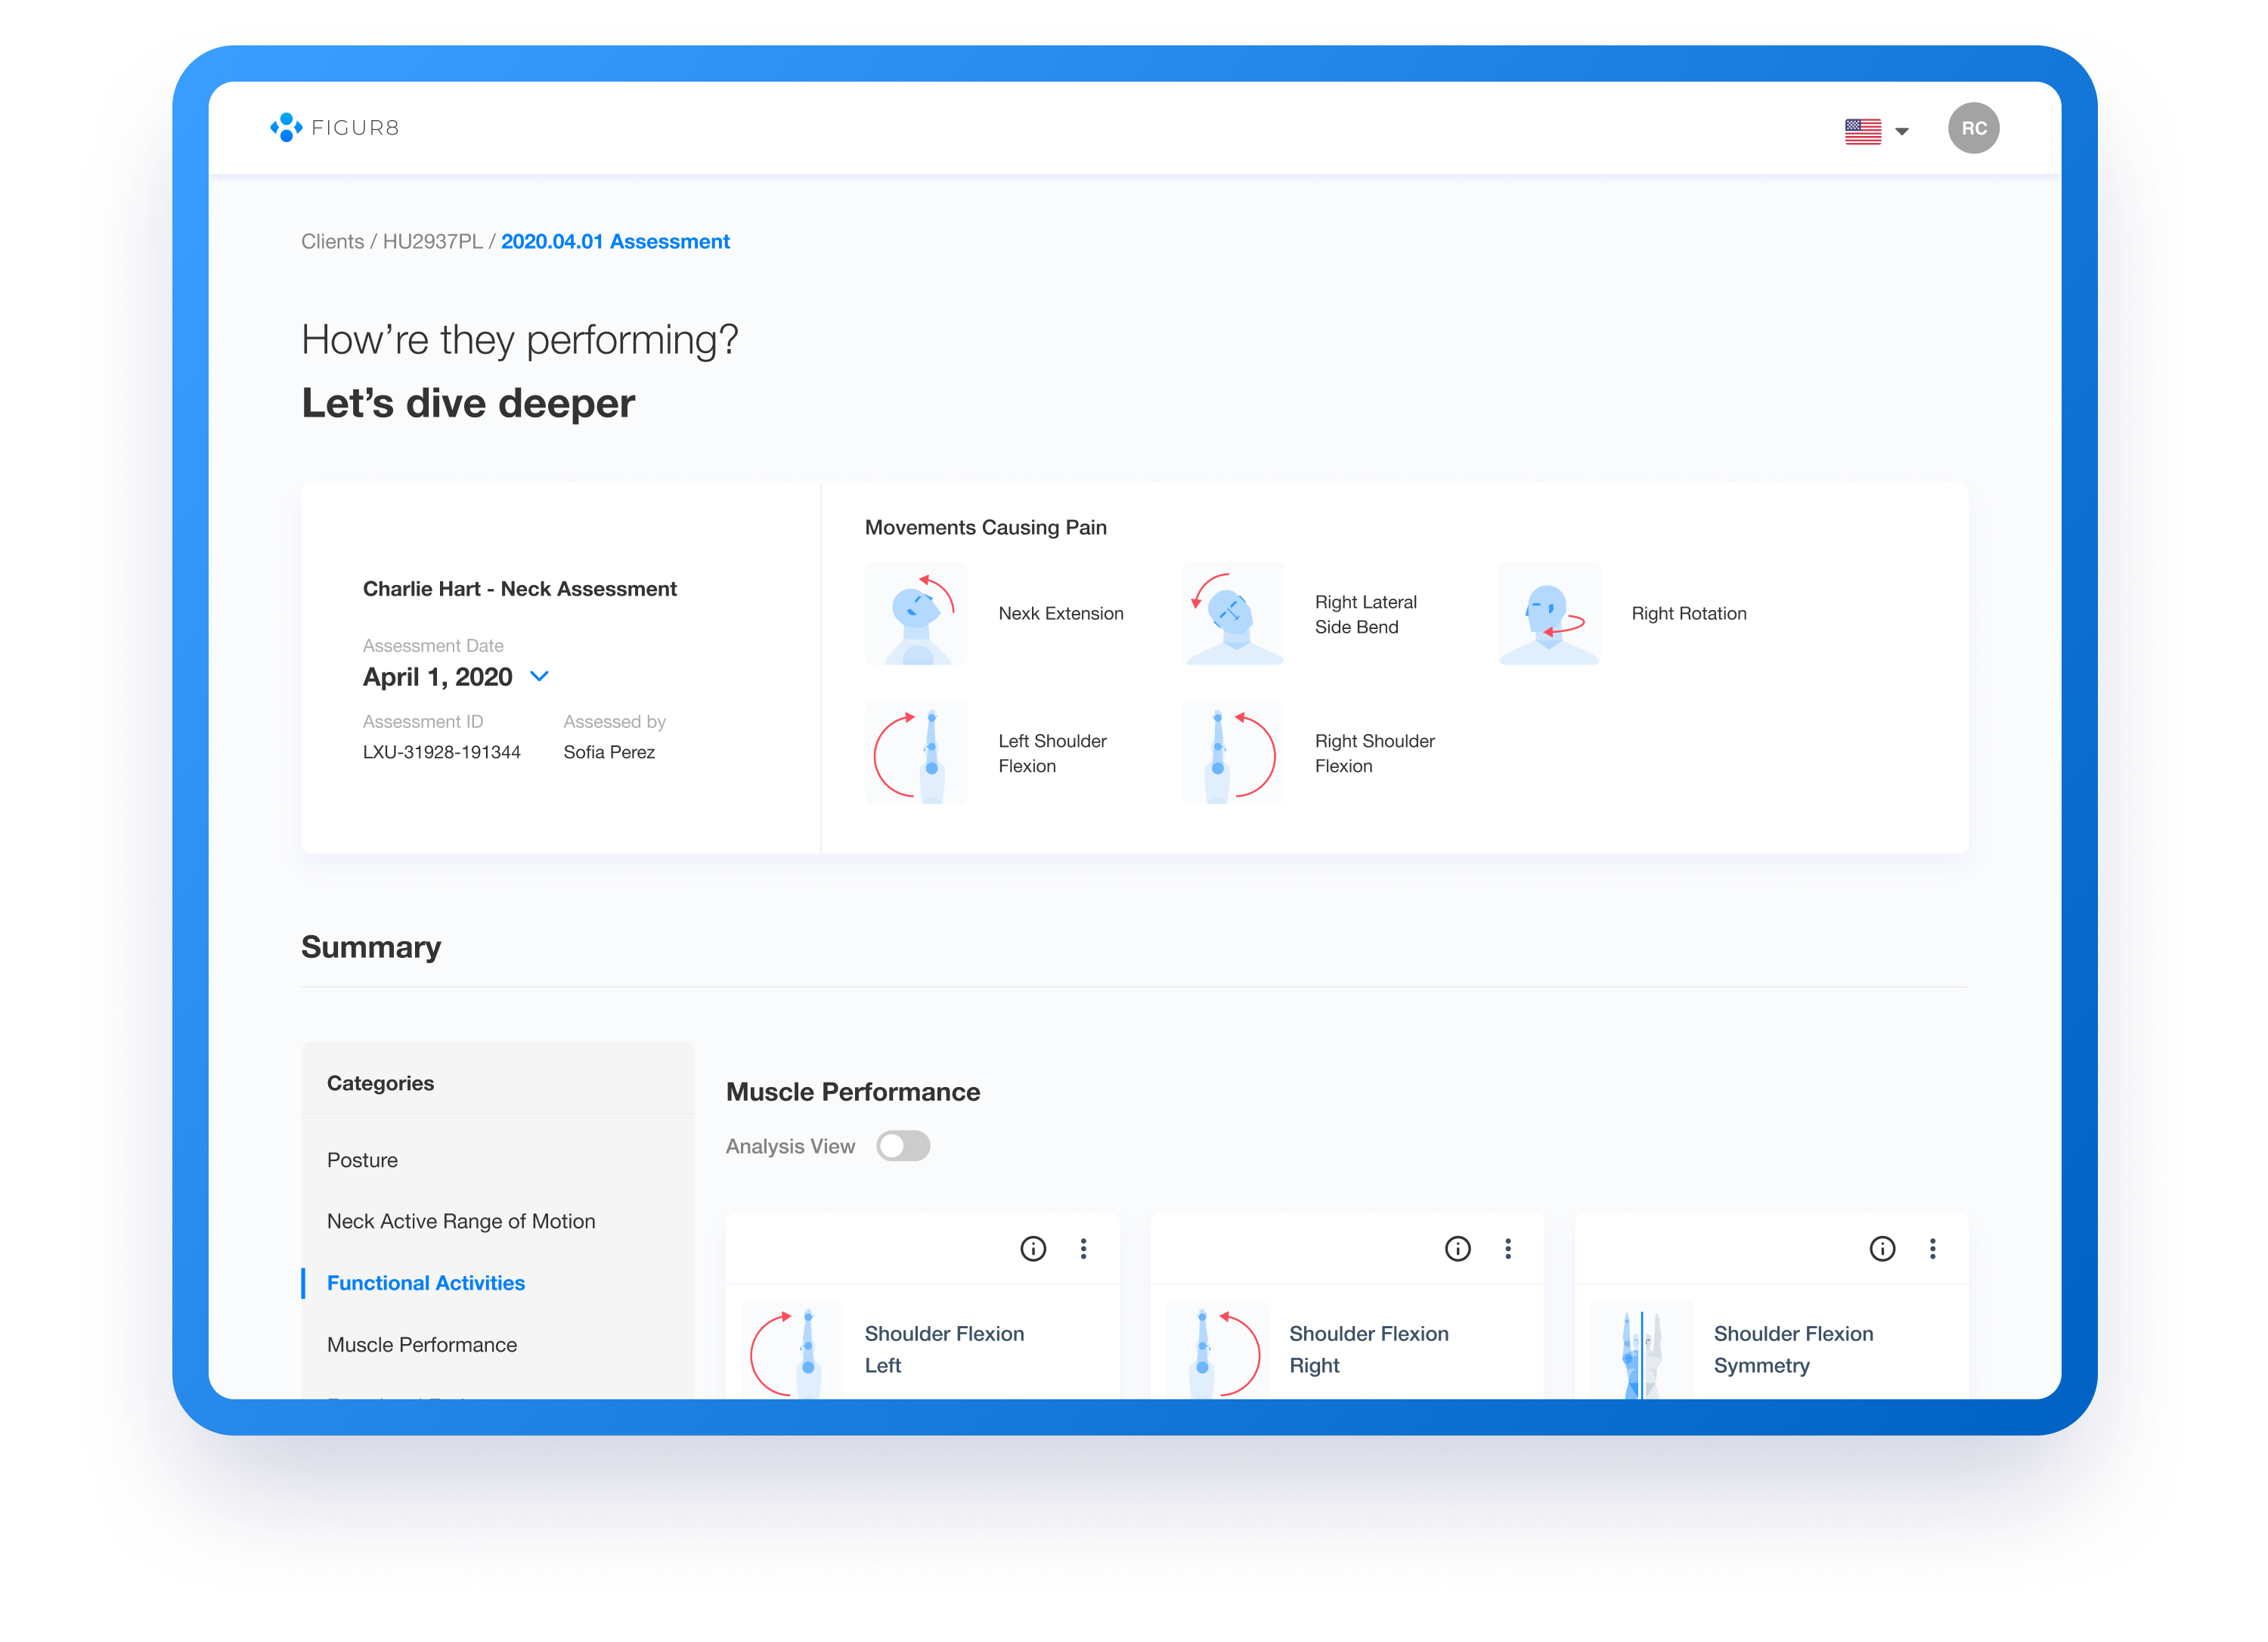
FIGUR8 technology seamlessly incorporates hardware, software, and biomechanics AI to accurately analyze musculoskeletal (MSK) health. My role in this project was to design the web portal where clinicians would view and analyze client data.

MY ROLE

Product Designer

TIMELINE

8 Weeks

THE PROBLEM

Uncomplicating complicated data

MSK biomechanical data can be complicated and often takes time to digest, even for trained experts. The challenge was to take that data and present it in a way that helps a clinician make faster and better decisions.

DEFINING THE USER

A busy clinician

With insight from the resident clinician on the science team I defined the user as busy clinicians that need to quickly and accurately pull useful insight from a client’s data. Afterwards I identified the needs the clinician would have if using the product.

USER NEEDS
  • Effective data visualization

  • Longitudinal data

  • Understanding key metrics at a glance

  • Insight at high and low levels

THE RESEARCH

Understanding the metrics

The focus of this project was specifically for whiplash injuries, so I collaborated with our science and research team to understand what are the key things that clinicians look for when examining whiplash. From there we worked to categorize the metrics into meaningful categories.

Posture
  • Sitting Posture

  • Standing Posture

Neck Range of Motion
  • Neck Flexion / Extension

  • Neck lateral side bend Left & Right

  • Neck rotation L & R

Functional Activities
  • Shoulder flexion L & R 

  • Shoulder flexion symmetry

Muscle Performance
  • Upper trapezius output symmetry

  • Upper trapezius rate of contraction

Functional Endurance
  • Neck elevation endurance

  • Shoulder elevation endurance

THE SOLUTION

A data dashboard that improves the patient – clinician experience

I designed the workflow to mirror how a clinician would typically approach a client assessment. A high level summary of the assessment is first shown allowing the clinician to quickly identify areas of concern, and then zooming in to understand all the details. Longitudinal data allows the clinician to identify trends to see if treatment is effective and the client is recovering.

Summary

Understanding the client’s overall movement

Analysis

Understanding the quality of the movement

History

Understanding client recovery

SCREEN DESIGN

Summary report

Summary view provide a high level overview of the metrics defined above. Each card provides a snapshot of how the client performed and how it compares to the previous assessment.

Analysis View

Provides indepth data about how the client moved through time and insight into the quality of that movement.

History View

Track and understand client trends to better determine if treatment is effective and recovery is on track.